Chapter 3: Comparing Group Means: Analysis of Variance
One-way Repeated Measures ANOVA
A repeated measures ANOVA is a statistical method that is used to test if the mean measurements across two or more than two times or conditions are significantly different from each other. In this way, a repeated measures ANOVA can be viewed as an extension to a paired or dependent samples t-tests that can examine three or more mean values differences.
Similar to the one-way ANOVA, a one-way repeated measures ANOVA includes one independent categorical or nominal variable and one continuous dependent variable which is measured at two, three, or more times or occasions. Because a one-way repeated measures ANOVA analyzes the mean measurements within the same participants across different times or occasions, it is also called within-subject ANOVA (since we are interested in knowing the change within the same group across times or conditions).
If the same group of subjects or participants are measured at two time points, we can use either a dependent samples t-tests or a repeated measures ANOVA. But if the same group is measured on a dependent variable at three or more time points or condition, a repeated measures ANOVA provides a more valid and robust analysis.
As an example, a researcher may be interested in knowing the effect of cardamom on depression. A random group of patients diagnosed with depression is recruited and asked to add cardamom to their daily meals or drinks (like tea). The researcher measures the depression levels in patients three times: right before adding cardamom to their foods, three months later, and finally six months later. There are three measurements of the same group on a continuous variable (depression). A one-way repeated measures ANOVA is appropriate to understand any significant changes within the subjects on their depression.
In the following sections, we introduce an example data set and demonstrate step by step how to measure any significant change in mean values over three time points in one group using one-way repeated measures ANOVA in R.
One-way Repeated Measures ANOVA Example
Does providing a school-based yoga program to primary school children reduce their math anxiety?

A primary school resident psychologist designed a study to investigate if practicing yoga in school would reduce students’ math anxiety. Math anxiety was measured by a valid and reliable math anxiety questionnaire. The staff administered the math anxiety test and randomly selected 25 students whose scores indicated a degree of math anxiety. These students were enrolled in a yoga program in their school environment. The yoga program lasted for six months. During the yoga practicing term, math anxiety among enrolled students was measured at three time points: at the beginning of the yoga program, three months into the program, and six months into the program.
In this study design, there is one group of students who are measured three times on a math anxiety measure. Therefore, the three measurements are dependent (coming from the same group). An appropriate statistical test to investigate any significant mean changes from time 1 to time 2 to time 3 (overall mean change) is a one-way repeated measures of ANOVA. Table 1 below shows the math anxiety scores for five students measured at three time points.
| Student | Time 1 | Time 2 | Time 3 |
|---|---|---|---|
| John | 71 | 49 | 63 |
| Meg | 83 | 59 | 43 |
| Muhammad | 58 | 52 | 37 |
| Sally | 68 | 48 | 50 |
| Ziba | 81 | 60 | 36 |
| ... | ... | ... |
The teacher prepares the data in a spreadsheet program and saves the file in the CSV format. The complete data set for this example can be downloaded from here.
R Analysis: One-way Repeated Measures ANOVA
In the first step, data are read into the RStudio program. To perform a one-way repeated measures ANOVA, the data must be structured in the long format. The data in Table 1 above is in wide format as each time point has its own column. We can collapse all the time points into one column and name it Time and then assign each anxiety score value the actual time point it was measured at. Table 2 illustrates the data in the long format structure.
| Student | Time | Anxiety score |
|---|---|---|
| John | Time 1 | 71 |
| John | Time 2 | 49 |
| John | Time 3 | 63 |
| Meg | Time 1 | 83 |
| Meg | Time 2 | 59 |
| Meg | Time 3 | 43 |
| ... | ... | ... |
If the original data comes in the wide format, we can convert it into the long format using different software programs, such as a spreadsheet. We can also use R to convert a wide format data set into long format data. Listing 1 provides the R code to convert wide format data into long format data structure.
library(tidyverse)

# Read in wide format data
dfMathAnxiety <- read.csv("dsMathAnxiety.csv")

# Convert to long format
dfMathAnxiety <- dfMathAnxiety %>%
  gather(key = "time", value = "anxiety_score", anxiety_t01, anxiety_t02, anxiety_t03) %>%
  convert_as_factor(student_id, time)
In Listing 1 code, we used the tidyverse library to convert our wide format data into long format structure using the gather() function, in which key is the name of the new variable that includes all individual time points and value is the name of the new dependent variable that stores the math anxiety scores. We have also used the function convert_as_factor() to convert student_id and time into factor variables. A factor variable is another name for a categorical variable.
Before performing a one-way repeated measures ANOVA, we produce a descriptive statistics table and a plot showing the mean scores of the students on the math anxiety measure at three time points. Table 3 below shows the descriptive statistics for the students' scores on math anxiety measures at the beginning, after three months, and after six months into the school yoga program.
| Statistic | Month 1 | Month 2 | Month 3 |
|---|---|---|---|
| Mean | 75.96 | 55.44 | 45.00 |
| SD | 11.06 | 3.98 | 11.27 |
Table 3 suggests that on average, the yoga program has reduced math test anxiety among the enrolled students. Figure 2 below shows a bar plot of the students' mean math anxiety scores at the beginning, after three months, and after six months into the school yoga program.
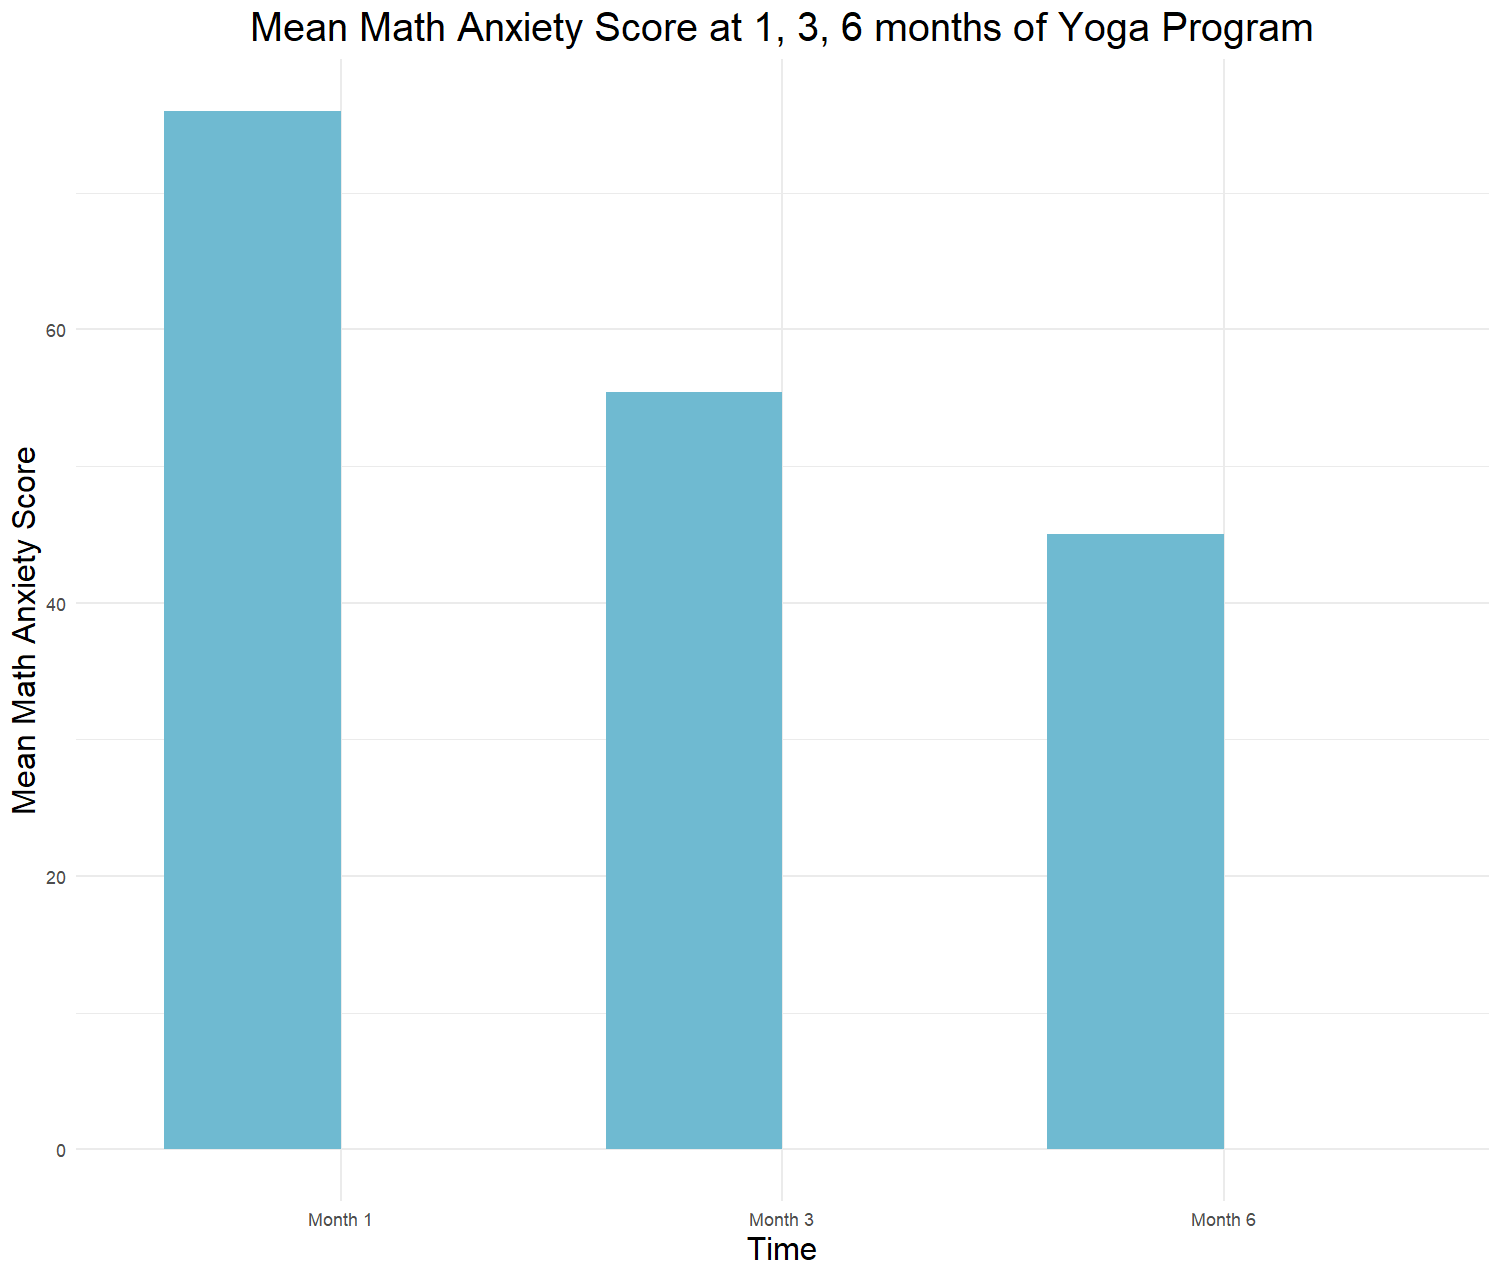
According to Figure 2, the math anxiety mean scores has decreased at the end of the school yoga program. But is the decrease statistically significant? We can find it out by performing a one-way repeated measures ANOVA on our data.
To perform a one-way repeated measures ANOVA on the data, we use the R package rstatix (see RStudio Environment about how to install a package in R). The following code in Listing 2 shows how to conduct a one-way repeated measures ANOVA in R.
> library(rstatix)

> modelRMANOVA <- anova_test(dv = anxiety_score,
				wid = student_id,
				within = time,
				data = dfMathAnxiety)

> print(modelRMANOVA)
ANOVA Table (type III tests)

$ANOVA
  Effect DFn DFd       F        p p<.05   ges
1   time   2  48 101.318 5.93e-18     * 0.661

$`Mauchly's Test for Sphericity`
  Effect     W     p p<.05
1   time 0.819 0.101

$`Sphericity Corrections`
  Effect   GGe      DF[GG]   p[GG] p[GG]<.05   HFe     DF[HF]    p[HF] p[HF]<.05
1   time 0.847 1.69, 40.65 1.5e-15         * 0.904 1.81, 43.4 1.88e-16
The code in Listing 2 shows that we have used the function anova_test() from the package rstatix to perform a one-way repeated measures ANOVA. The parameters of anova_test() function in this example analysis include the dependent variable name (dv), the participants ID (wid), and the time (within, which indicates we are investigating participants' test anxiety within themselves across time points.)
The output to the anova_test() function includes three major pieces of information. The first part is the ANOVA results, which shows that (independent variable) time has a statistically significant effect. Therefore, we conclude that the math anxiety scores have significantly changed on average across time points, implying the effectiveness of the yoga practice program.
The second part of the output shows the results of the Mauchly's test for sphericity. Sphericity is an assumption in repeated measures ANOVA that requires the equality of variances of the differences between values in each pair combination. For example, the variance of difference values between Time 1 and Time 2 should be equal to the variance of difference values between Time 1 and Time 3, and variances differences of Time 2 and Time 3. In the output, the Mauchly's test for sphericity shows that there is not a statistically significant difference between variances. So, this assumption is met, and the interpretation of the ANOVA part of the results is valid.
The third piece of the output (Sphericity corrections) is used when the sphericity assumption is not met. In that case, the ANOVA results will be adjusted using different methods, such as Greenhouse-Geisser estimate (GGe) or Huynh-Feldt estimate (HFe). In both sphericity correction methods, we can see that the effect of time is significant, implying the effectiveness of the yoga training program on reducing the math anxiety scores of students.
Now that we know the effect of the yoga training program (time) is statistically significant (p < 0.01), we would like to know if the changes on average math anxiety scores between Time 1, Time 2, and Time 3 are also statistically significant from each other. This is similar to one-way ANOVA, where we would be interested in knowing which groups are statistically different from each other on the dependent variable. We can use pair-wise t-test to understand which pairs of time points are significantly different from each other. Listing 3 shows how to perform pair-wise comparison among different time points.
> pwComp <- dfMathAnxiety %>% pairwise_t_test(
    anxiety_score ~ time, paired = TRUE,
    p.adjust.method = "bonferroni"
  )
> print(pwComp)

  .y.           group1      group2         n1    n2 statistic    df        p    p.adj p.adj.signif
*
1 anxiety_score anxiety_t01 anxiety_t02    25    25     12.2     24 8.59e-12 2.58e-11 ****
2 anxiety_score anxiety_t01 anxiety_t03    25    25     12.6     24 4.82e-12 1.45e-11 ****
3 anxiety_score anxiety_t02 anxiety_t03    25    25      4.34    24 2.25e- 4 6.75e- 4 ***
In Listing 3 R code, we have specified the pair comparisons. Because we are using paired t-tests for three groups, we need to adjust for the familywise error using the Bonferroni adjustment so that Type I error (false positive) occurrence is reduced. In the output, y is the dependent variable (math anxiety score), group 1 and group 2 columns show which time points are being compared, the n1 and n2 indicate the sample sizes in each group (time point), the statistic shows the difference in means (because we want to know if the difference in mean values from Time 1 to Time 2 to Time 3 are statistically significant), df is the degrees of freedom, and p and p.adj are the probability values.
By looking at p.adj, we can see that all pair comparisons are statistically significant, implying that average changes across time points are statistically significant, showing the effectiveness of the yoga practice program on reducing math anxiety.